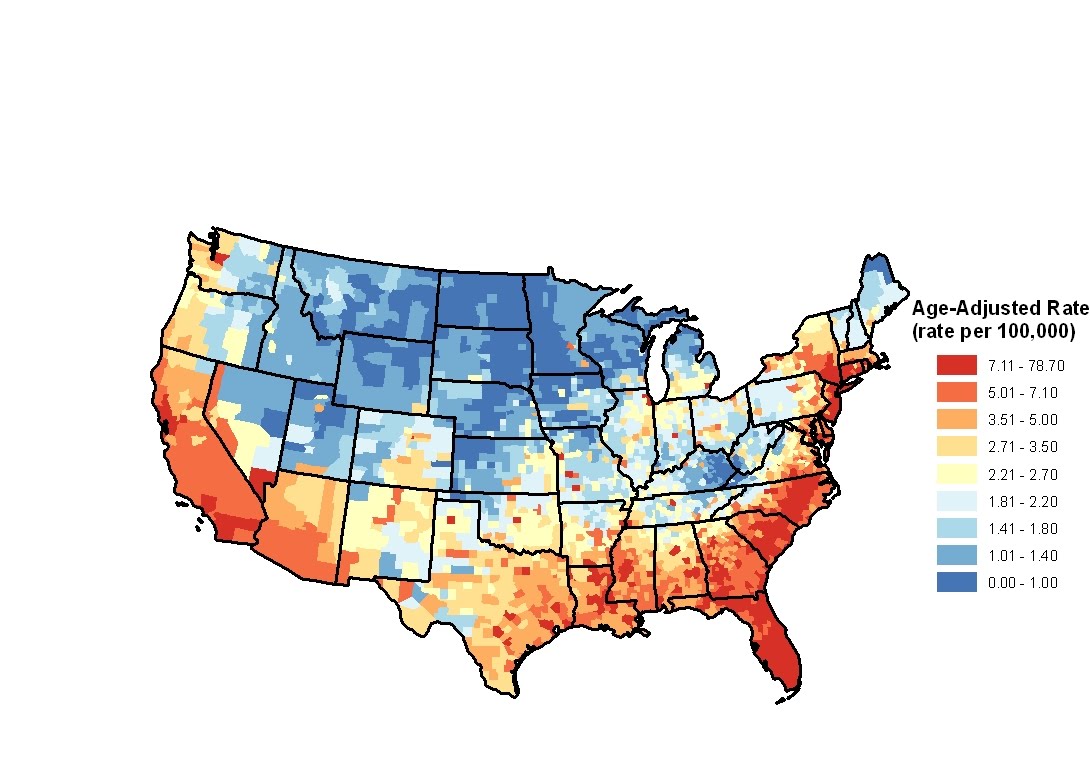
Spatial data analysis involves data that represents points (e.g. soil core samples) or regions (e.g. counties), and can be regularly or irregularly spaced. The variable of interest may be discrete or continuous. The objective of a spatial data analysis may be to capture the trends apparent in the data set, e.g. showing that HIV mortality rates are less prevalent as one goes from south to north as shown in the figure above.
Most of the existing literature in spatial data analysis presents studies with data that are regular, points and continuous. In my work, I will focus on discrete data collected on irregular spaced intervals, representing regions. With regions, or lattice models, typically regions are linked or correlated with their neighbors. In irregular regions, neighbors are not immediately  apparent. Sometimes it may be necessary to define what constitutes a neighbor, such as less than a fixed distance away. In my models, the locations are fixed or determined by the investigator and I may be interested in the number of cancer cases occuring in a region. In other models, the locations may be the primary interest, e.g. the location of a cancer case, to see if cancer cases are spatially clustered as shown in the figure above.
 apparent. Sometimes it may be necessary to define what constitutes a neighbor, such as less than a fixed distance away. In my models, the locations are fixed or determined by the investigator and I may be interested in the number of cancer cases occuring in a region. In other models, the locations may be the primary interest, e.g. the location of a cancer case, to see if cancer cases are spatially clustered as shown in the figure above.
Spatial models on a lattice are analogous to time-series models in the sense that when building models for data on a lattice, there is not a realization occurring between locations or regions. In time-series you assume that a realization does not occur between the months of June and July if your index is in months. The main idea for my research is to develop and evaluate method that model the distribution of discrete outcomes when a location will depend on its neighbors. In spatial data, we do not have the unidirectional flow of time that occurs with time series. Therefore, spatial models are built on nearest neighbors.
